
Viability and Hyaluronic Acid Study
1.0 OBJECTIVE
A fibroblast cell culture model was used to assess the ability of the test materials to exert an effect on hyaluronic acid synthesis. This study also assessed the viability of the cells after exposure to the test materials.
2.0 Methods
2.1 Preparation of Fibroblasts
Fibroblasts were seeded into the individual wells of a 24-well plate in 0.5 ml of Fibroblast Growth Media (FGM) and incubated overnight at 37+2oC and 5+1% CO2. On the following day the media was removed via aspiration to eliminate any non-adherent cells and replaced with 0.5 ml of fresh FGM. The cells were grown until confluent, with a media change every 48 to 72 hours. Upon reaching confluency the cells were treated for 24 hours with DMEM supplemented with 1.5% FBS to wash out any effects from the growth factors included in the normal culture media. After this 24-hour wash out period the cells were treated with the test materials at the specified concentrations dissolved in FGM with 1.5% FBS. TGF-B (50 ng/ml) was used as a positive control for collagen and elastin, while 100 uM DbcAMP was used as a positive control for hyaluronic acid. Untreated cells (negative controls) just received DMEM with 1.5% FBS. The cells were incubated for 48 hours and at the end of the incubation period cell culture medium was collected and either stored frozen (-75°C) or assayed immediately. Materials were tested in triplicate.
2.2 MTT Assay
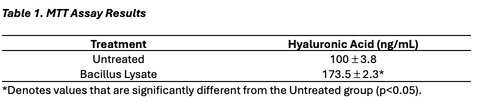
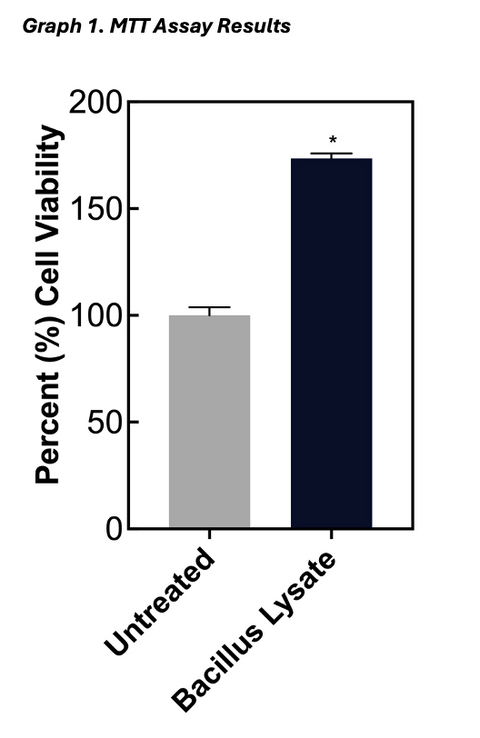
After the 2-day incubation, the cell culture medium was removed (see above) and the fibroblasts were washed twice with PBS to remove any remaining test material. After the final wash, 500 μl of DMEM supplemented with 0.5 mg/ml MTT was added to each well and the cells were incubated for 1 hour at 37+2oC and 5+1% CO2. After the incubation, the DMEM/MTT solution was removed, and the cells were washed again once with PBS and then 0.5 ml of isopropyl alcohol was added to the well to extract the purple formazin crystals. Two hundred microliters of the isopropyl extracts were transferred to a 96-well plate and the plate was read at 540 nm using isopropyl alcohol as a blank. The mean MTT absorbance value for the negative control cells was calculated and used to represent 100% cell viability. The individual MTT values from the cells undergoing the various treatments were then divided by the mean value for the negative control cells and expressed as a percent to determine the change in cell viability caused by each treatment
2.3 Hyaluronic Acid Assay
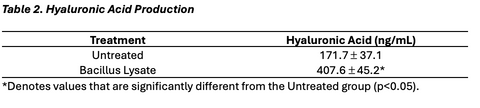
A series of hyaluronic acid standards was prepared ranging from 50 ng/ml to 3,200 ng/ml. Next, 100 μl of each standard and sample was transferred to a well in an incubation plate. After adding 50 μl of detection solution to each well (except the reagent blank wells) the plate was incubated for 1±0.25 hour at 37±2°C. After the incubation, 100 μl of each sample/standard from the incubation plate was transferred to a corresponding well in the ELISA plate. The ELISA plate was covered and incubated for 30±5 minutes at 4°C and then washed three times with 300 μl of wash buffer. After the final wash 100 μl of enzyme solution was added to each well and the plate was incubated at 37±2°C for 30 ±5 minutes. After this incubation the wells were washed again as described above and then 100 μl of enzyme substrate solution was added to each well and the plate was incubated for 30-45 minutes at room temperature. After this final incubation 50 μl of stop solution was added to each well and the absorbance of the plate was measured at 405 nm using a plate reader.
3.0 Results
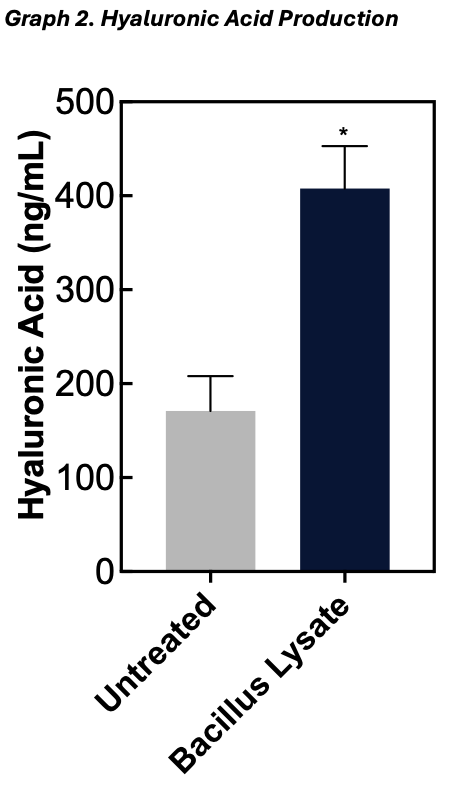
The results for the MTT assay are presented in Table and Graph 1, with the values presented as the mean percent viability ± _the standard deviation of the mean. The results for the Hyaluronic Acid study can be found in Table and Graph 2. These values are presented as mean concentration (ng/ml) ± _the standard deviation of the mean.
4.0 Discussion
A fibroblast cell culture model was used to assess the ability of the test materials to exert an effect on cell viability and hyaluronic acid synthesis. The material was observed to significantly increase fibroblast viability and hyaluronic acid production within this model.